This post is a summary of our latest paper [1] and open dataset [2] on next generation city-descriptive input data for urban climate models.
Authors: Mathew Lipson, Negin Nazarian, Melissa A. Hart, Kerry A. Nice and Brooke Conroy
- Read the full paper here: https://doi.org/10.3389/fenvs.2022.866398
- Get the greater Sydney dataset here: https://doi.org/10.5281/zenodo.6579061
A transformation is underway in how urban characteristics are described in numerical modelling, enabled by a new generation of sub-metre urban morphology datasets covering entire continents, powered by machine learning, satellite imagery and remote sensing.
From these new datasets we can, for the first time, configure our urban climate models across large geographical extents with unparalleled accuracy, from the ‘bottom-up’.
For this project we partnered with two organisations:
- AURIN: the Australian Urban Research Infrastructure Network. They provided access to the new datasets for our research.
- Geoscape: a company who produced the spatial data across Australia that we used.
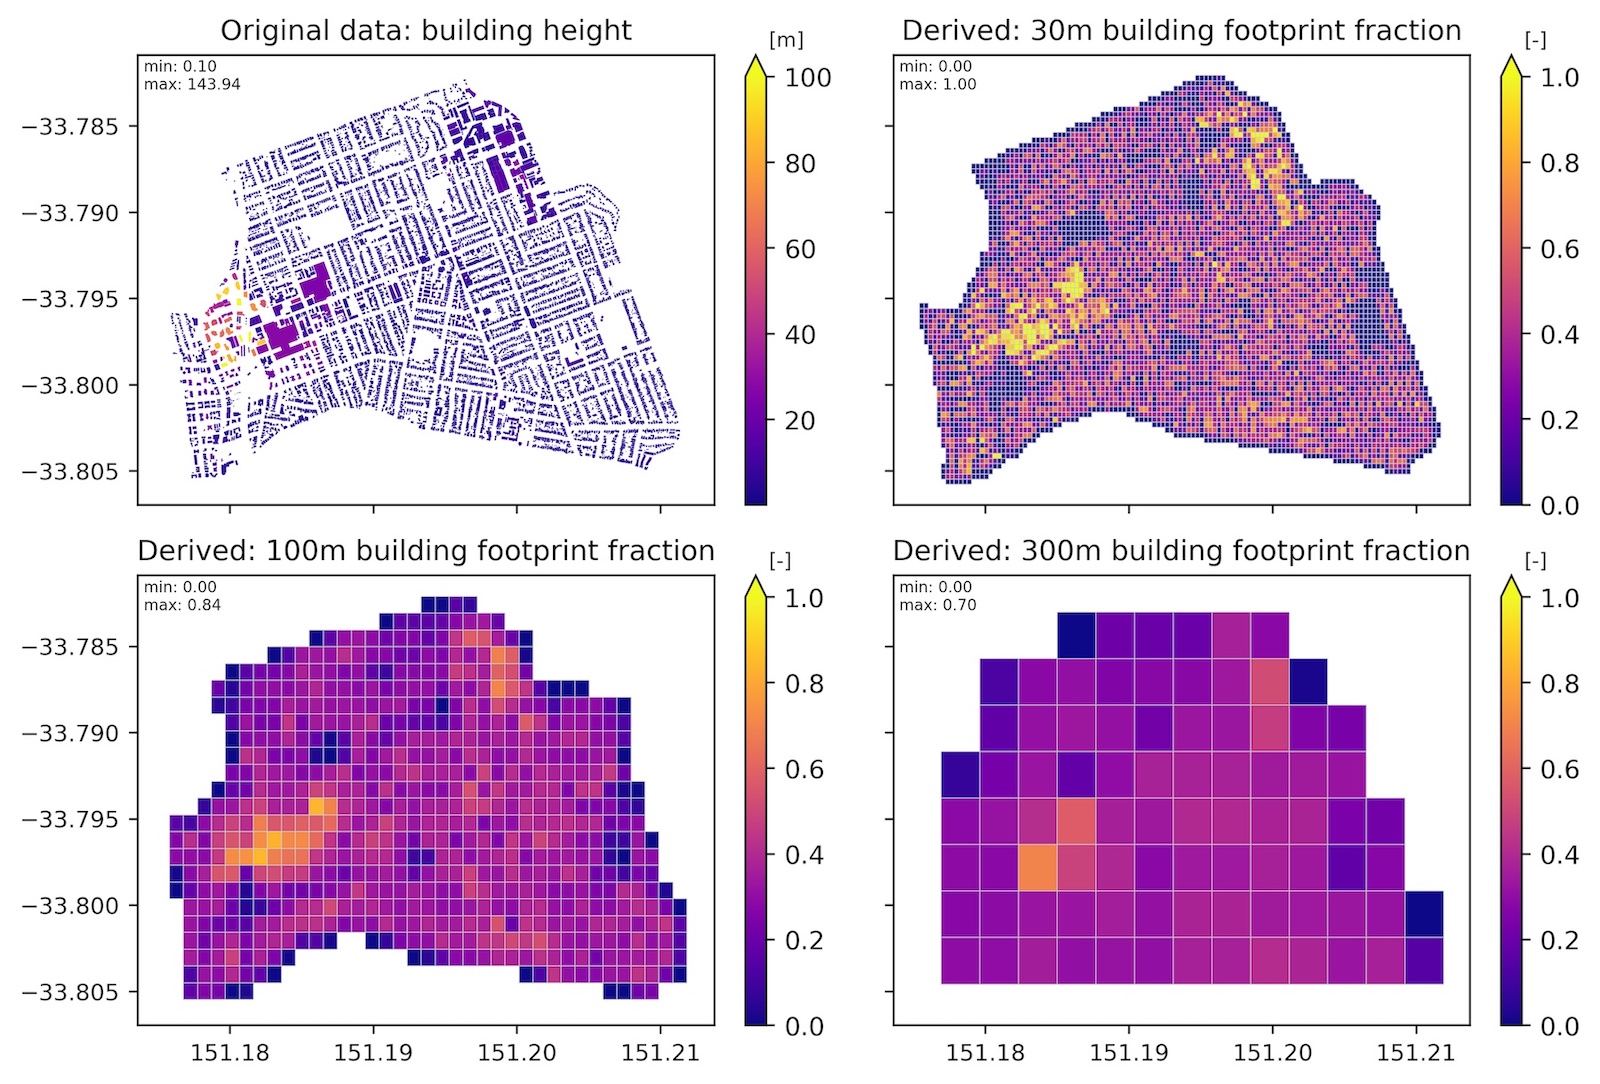
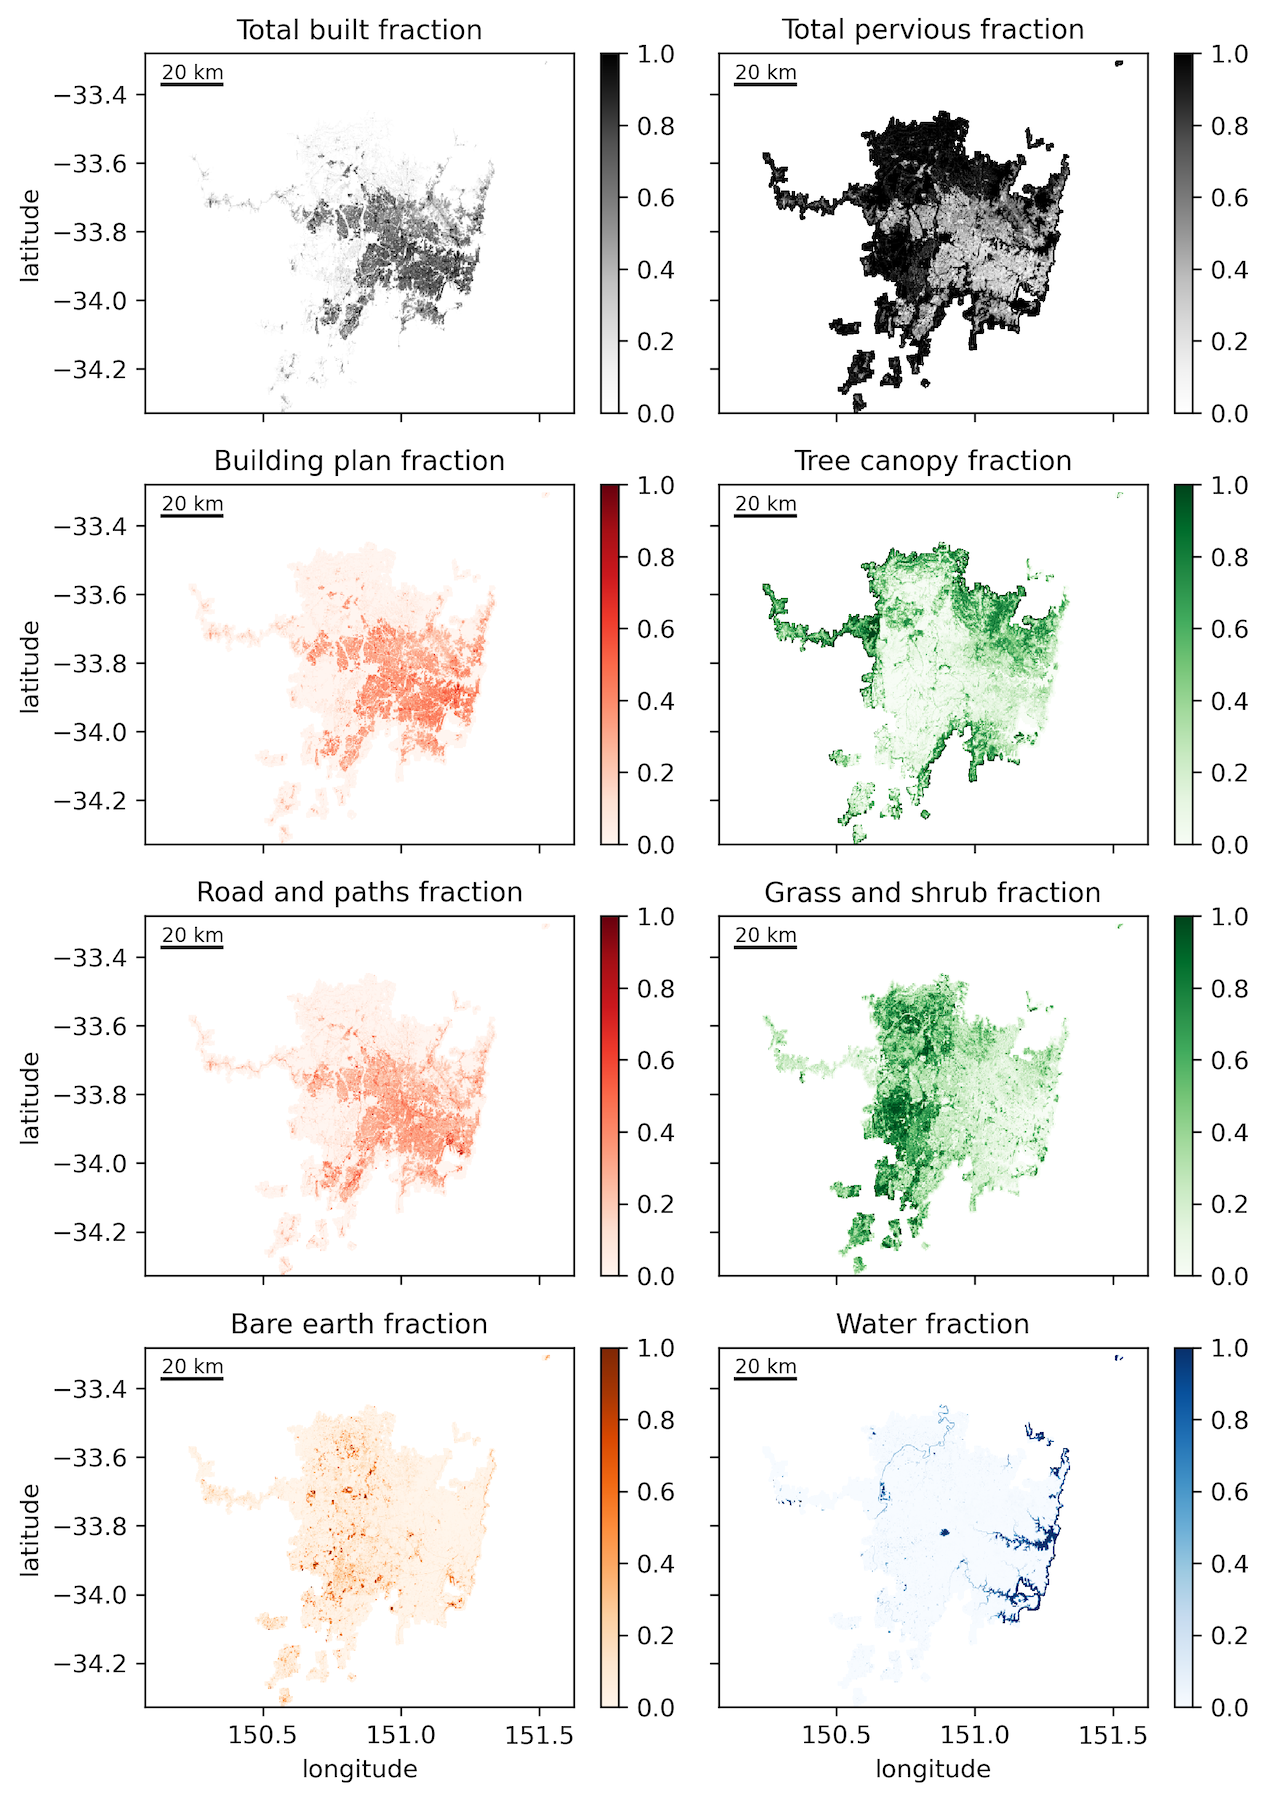
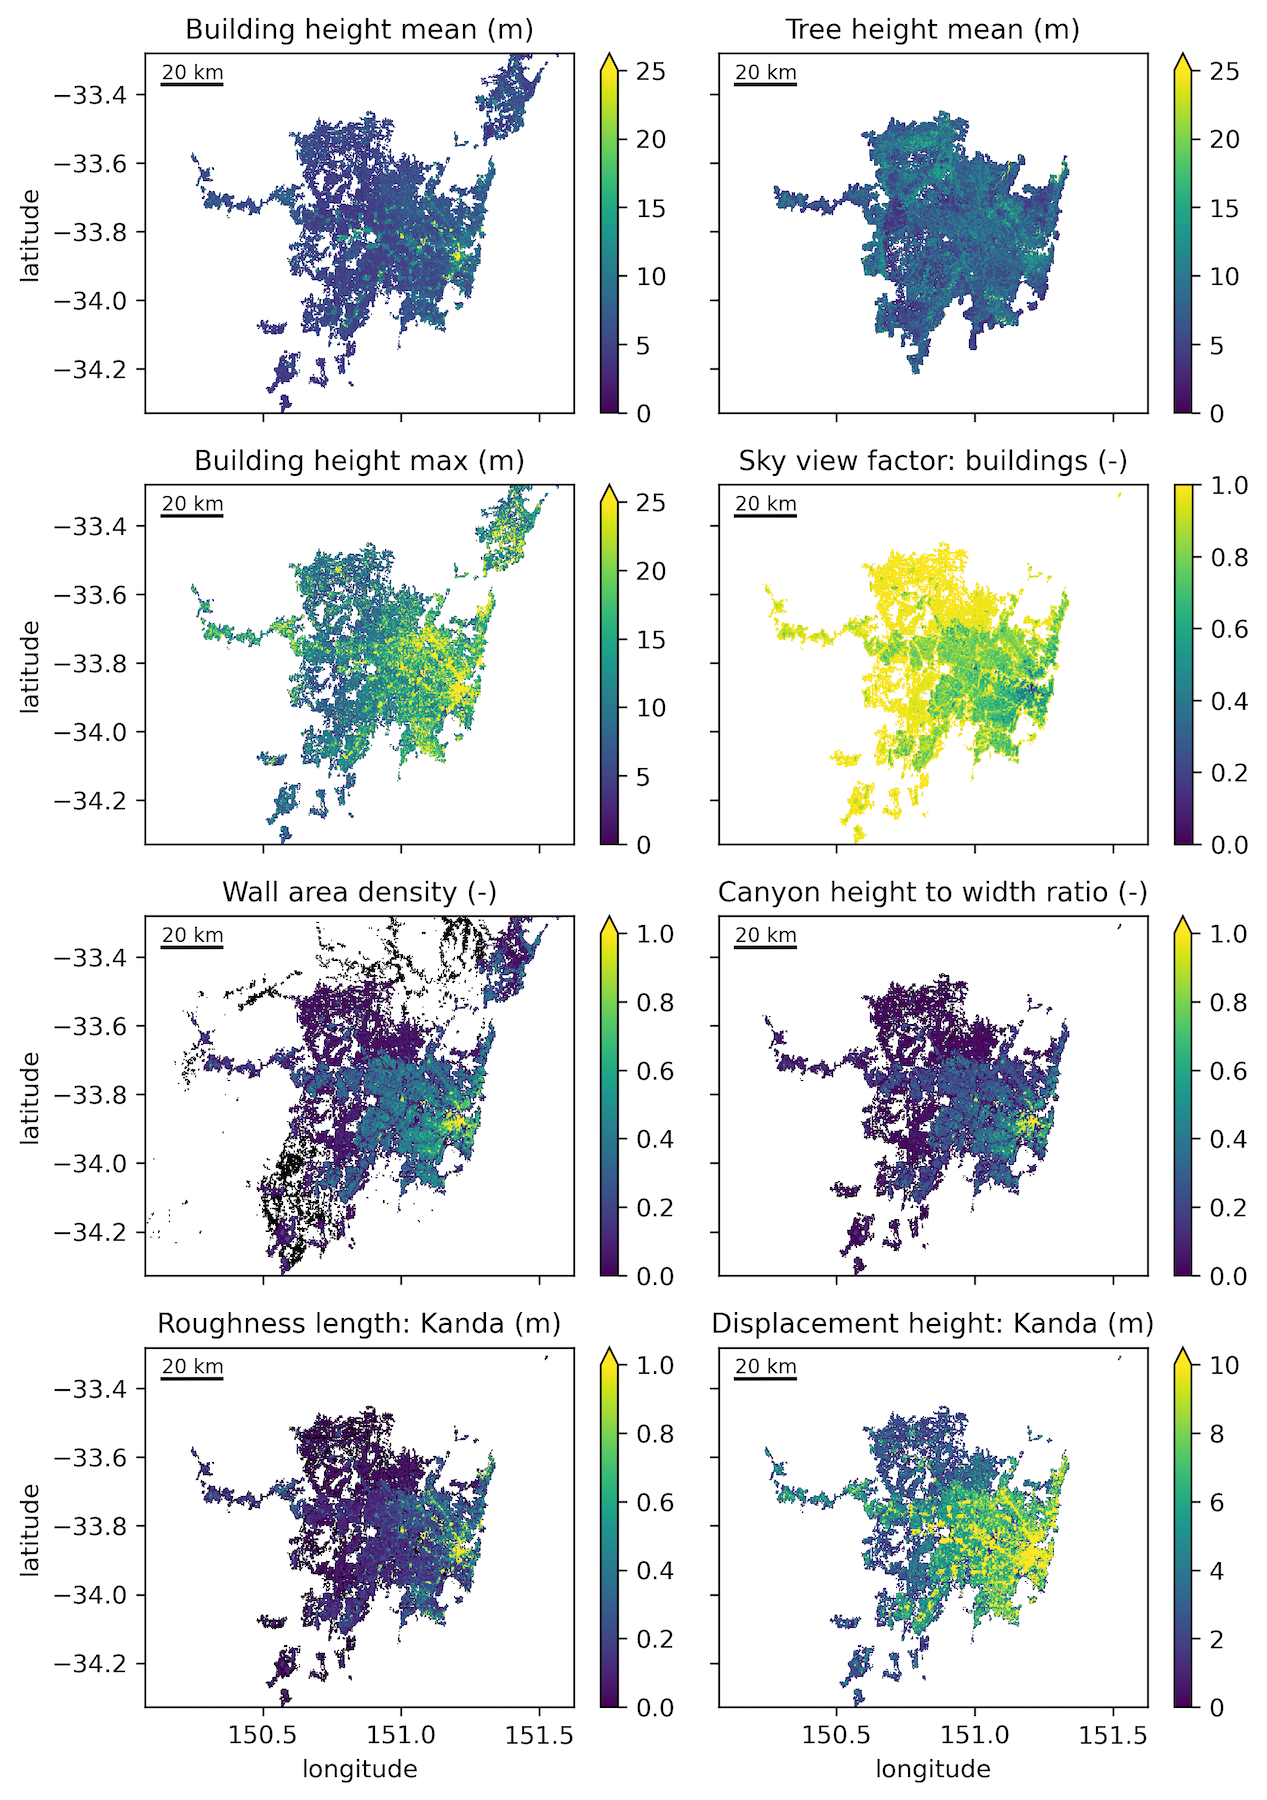
Geoscape are the developers of the first continental-scale building-resolving morphology dataset available (that we’re aware of), which includes the shape and height of every building in Australia larger than 9 sq. m (a small bedroom), and the surface cover of all Australian urban areas at 2 m resolution.
You can check out a sample here: https://geoscape.com.au/get-sample/
From this valuable data we derived new datasets for Sydney and Melbourne with 25 parameters used to configure slab, canyon or block array urban land surface models, and we negotiated with Geoscape to make the derived Sydney data openly available at 300 m resolutions (i.e. suitable for high resolution urban climate modelling).
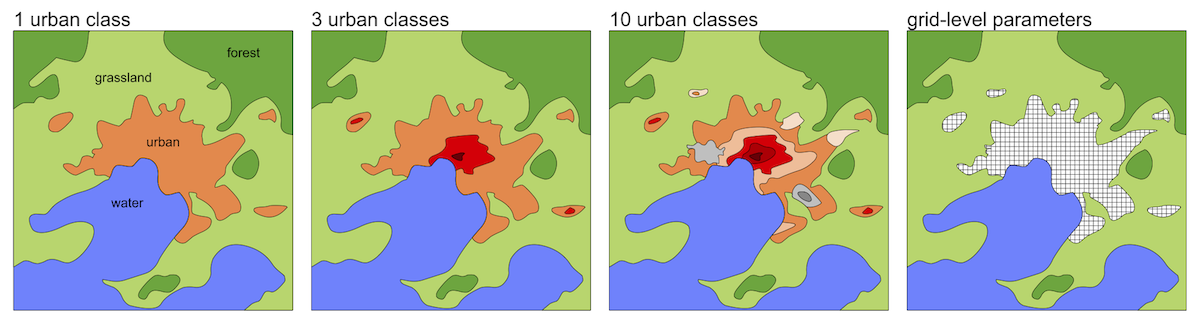
This bottom-up approach is in stark contrast to the top-down, or class-based methods traditionally used to configure urban models since urban modelling began fifty years ago. We compare the latest top-down methods (e.g. the 10-class Local Climate Zones) with our bottom-up approach, and provide tables of adjusted parameter values that are more appropriate for those using class-based modelling in Australian cities.
There are some unresolved questions about processing for different scales. Some of our methods don’t make sense below approx. 100 m grid resolution. However, the types of models using this data are designed to run at coarser neighbourhood or suburb scale grids, and they themselves stop making sense below 100m resolution.
We also discuss the future of top-down vs bottom-up methods of configuring urban models, and predict that bottom-up approaches will come to replace top-down methods as consistent building-resolving datasets become more widely and openly available.
 |
 |
- Read the full paper here: https://doi.org/10.3389/fenvs.2022.866398
- Get the greater Sydney dataset here: https://doi.org/10.5281/zenodo.6579061