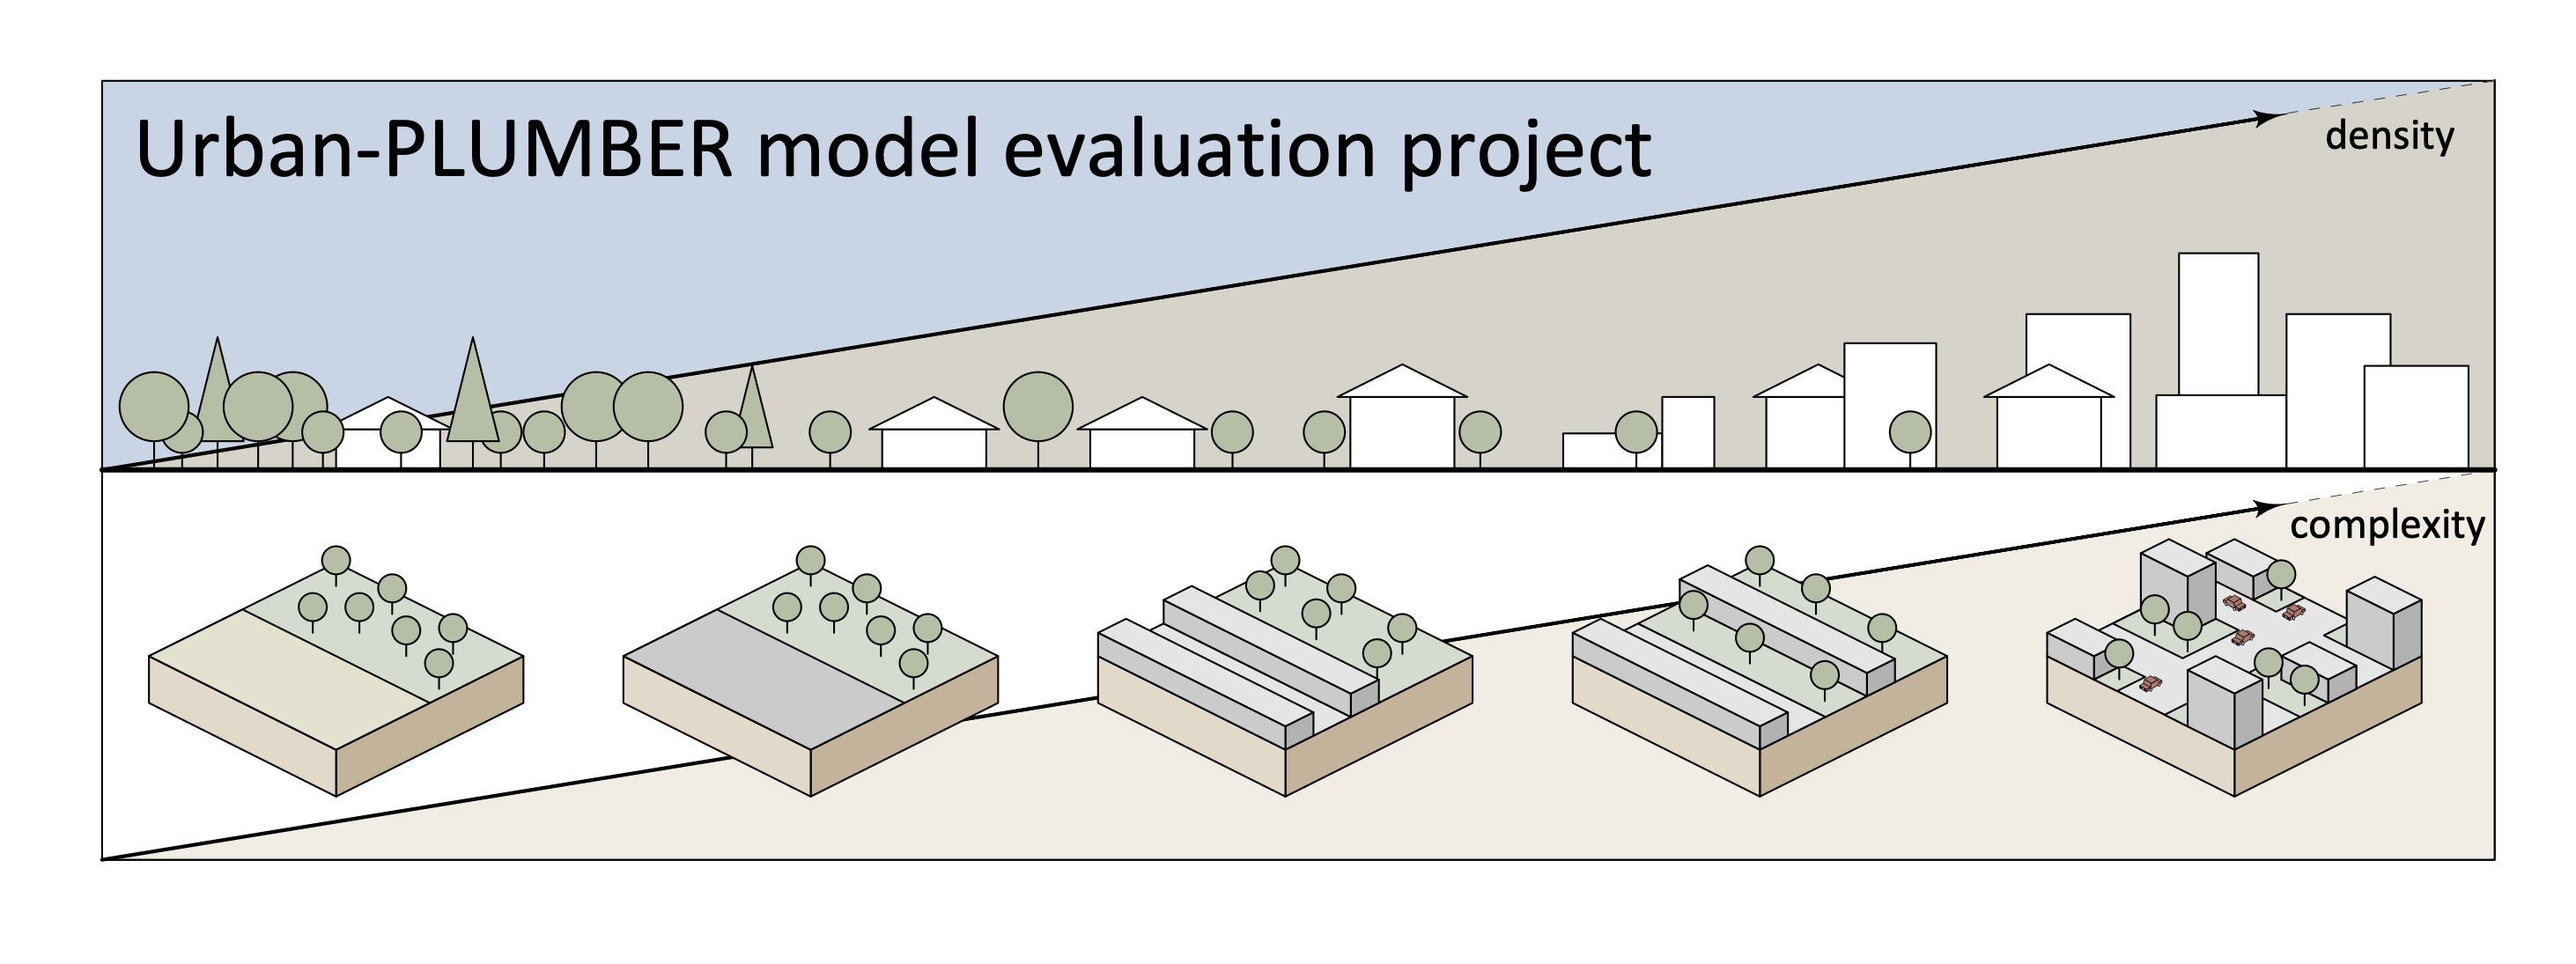
The first model evaluation results from the Urban-PLUMBER project are now published!

Our new paper brings together 20 urban flux tower sites from around the world into a harmonised, gap filled, quality controlled collection. The collection is openly available. Read more by clicking here.

This is an updated post to show how to build an xarray dataset from scratch.
I’ve also shown how to reproject datasets to other coordinate systems using rioxarray, and write CF compliant coordinate mapping information to allow correct loading into software like QGIS.

This post shows code to import OpenStreetMap and satellite images into Python’s Cartopy.
Inputs are:

I presented an introduction to the Urban-PLUMBER project at EGU 2020, held online rather than in Vienna as normal. Download the presentation here.
You can also read the latest about the project here: https://urban-plumber.github.io/.

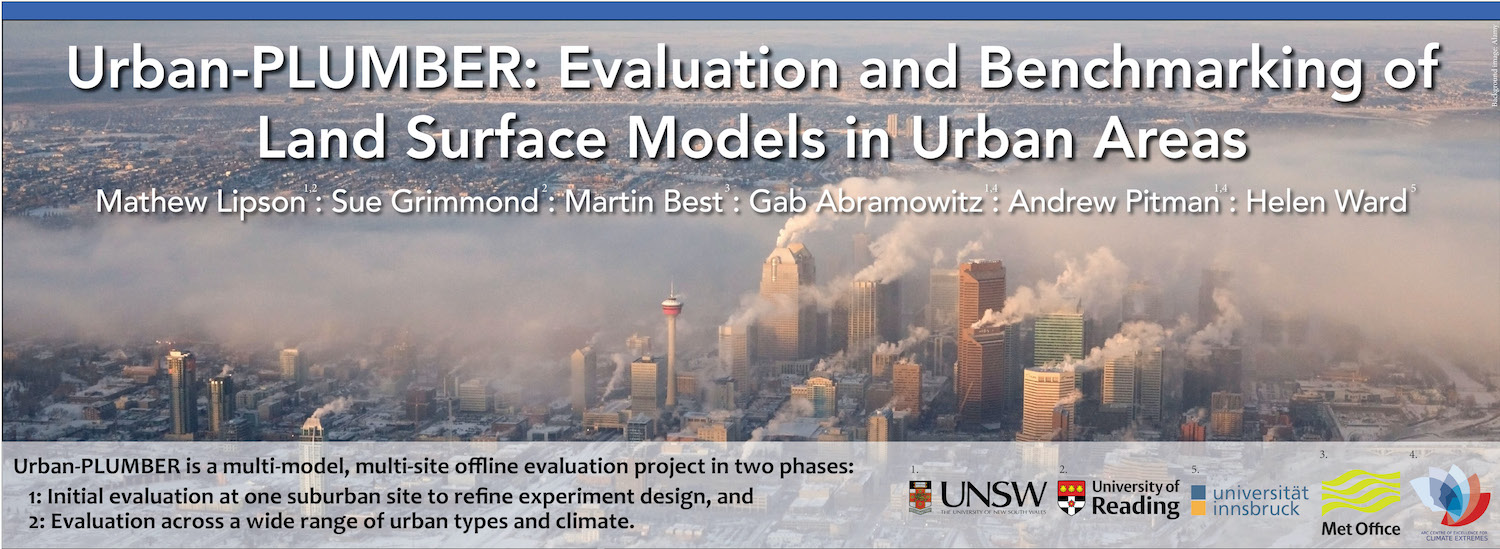
At the American Meteorological Society (AMS) 100th Annual Meeting we introduced Urban-PLUMBER: evaluation and benchmarking of land surface models in urban areas [1].
The project is a collaboration of modelling groups from around the world interested in improving the accuracy of weather and climate simulations in urban areas. Read how to get involved below, or download the Urban-PLUMBER poster for the 2020 AMS annual meeting here.

Last week I presented some initial results of our new building energy/ urban land surface model (UCLEM) 1 coupled with an atmospheric climate model (CCAM) 2 at the EGU 2019 conference.
You can read more about UCLEM here, but in short it responds to local weather and calculates energy consumed inside buildings (from heating and cooling and other energy use) and then emits that energy as waste heat back into the environment. In dense urban areas that waste heat can raise air temperature and cause convection, changing local weather in a feedback loop. Apart from that, it’s useful to know how much energy is being used in different weather conditions.
This first animation shows the air temperature over Eastern Australia, along with the energy used within buildings. The second is nested within the first for a higher resolution simulation over Melbourne.

Next week I’ll be at the annual workshop for ARC Centre of Excellence for Climate Extremes (CLEX) group. The workshop is a chance to hear about the work researchers have been doing over the last 12 months or so, and discuss future research goals.
Below is the poster I’ll be presenting. The images in this PDF version are higher quality.

It’s been a while since I posted as I’ve been focussed on finishing the PhD thesis, which is now submitted. In the coming months I’ll be trying to summarise the work here and keep current research more up to date. In the meantime I’ll document some of the posters I’ve presented at workshops over the last few years.

This extends a previous post on anthropogenic waste heat to include plots for New York and London.

Writing an article in LaTeX produces crisp, quality documents and beautiful equations. However, it’s not very user friendly. Recently I’ve been using another language, Markdown, because I find it more readable and intuitive, but it still has LaTeX equation support. To me that’s the best of both worlds. So how about writing an entire PhD thesis in Markdown? This post shows you how.

I’ve recently finished developing a computational model which predicts the heating and cooling energy demands of a neighbourhood based on building characteristics, meteorological conditions and the behaviour of people. However, I don’t have a perfect and complete set of observations to describe the system, and I am finding it difficult to find appropriate values for some parameters. So I’ve used machine learning to help.

Cities can be much hotter than surrounding regions. This is in part because of waste heat from our energy use. This post shows how much waste heat is emitted during a typical day into Melbourne, Australia.

This post describes how our interface conduction scheme is formulated and computed, and finishes with Fortran code which solves various approximations of the heat equation.

I’m new to building websites, so didn’t know where to begin.
I knew I wanted a simple end product that I had full control over at the lowest possible cost, and that I was comfortable with command line interfaces.
Here is where I ended up.

Our cities are getting hotter. We can do something about it, but it isn’t a case of one-size-fits-all.